Robustness to model misspecification
Example_on_other_settings.Rmd
library(CoOPLBM)
#> Loading required package: robber
#> Estimation of the Robustness of Bipartite Ecological Networks!
library(pROC)
#> Type 'citation("pROC")' for a citation.
#>
#> Attaching package: 'pROC'
#> The following objects are masked from 'package:stats':
#>
#>     cov, smooth, var
library(ggplot2)
library(reshape2)
library(aricode)
library(gridExtra)
library(sbm)
To show the robustness of the developed algorithm for CoOP-LBM, a series of examples is available on this page, where the settings are different from the one defined in the article. The criterion used to compare the quality of the estimation is the AUC of the probability of finding the missing links in \(M\), and the ARI score of the estimated clustering with the true clustering.
n1 = 100
n2 = 100
Q1 = 3
Q2 = 3
P =matrix(c(0.95,0.75,0.5,
                 0.75,0.5,0.5,
                 0.5,0.5,0.05),Q1,Q2)


alpha1 = c(1/3,1/3,1/3)
alpha2 = c(1/3,1/3,1/3)
G=50
\(N_{i,j}\) is a Gamma-Poisson mixture
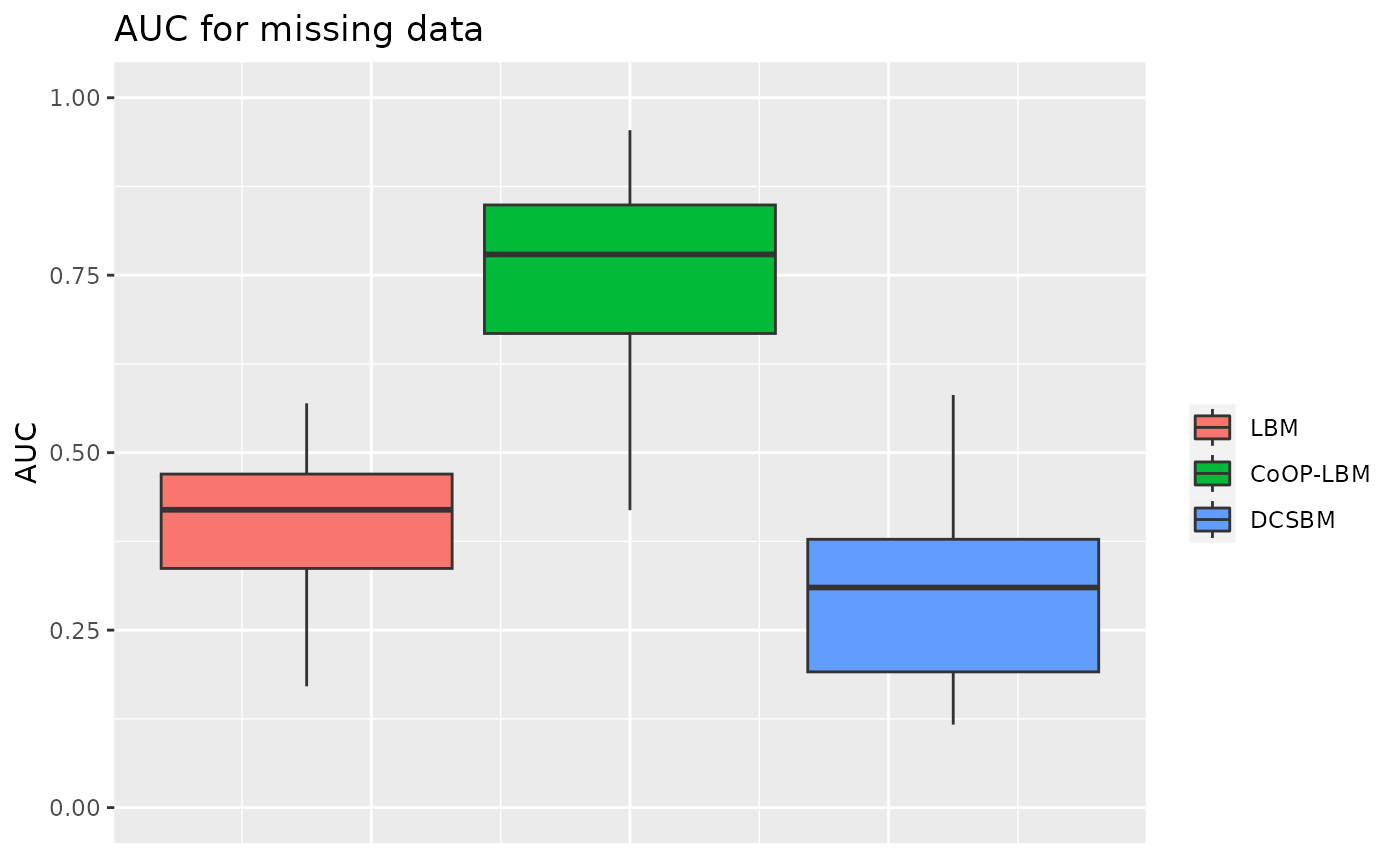
In order to increase the variance of \(N_{i,j}\), we will now have \(N_{i,j}\sim\mathcal{P}(\nu_{i,j})\) where \(\nu_{i,j}\) is a Gamma random variable of shape \(G/p\) and scale \(\lambda_i\mu_jp\) with \(p\) any positive number. In this example we will take \(p = 4\).
result1 = data.frame(ARI_row_LBM=numeric(),
                    ARI_col_LBM=numeric(),
                    ARI_row_CoOP = numeric(),
                    ARI_col_CoOP = numeric(),
                    ARI_row_DCSBM = numeric(),
                    ARI_col_DCSBM = numeric(),
                    AUC_LBM = numeric(),
                    AUC_CoOP = numeric(),
                    AUC_DCSBM = numeric()
                   )
for (k in 1:30){
simulation1=simulate_lbm(P,alpha1,alpha2,n1,n2)
M = simulation1$A
Z1 =simulation1$Z
Z2 =simulation1$W
lambda_i =rbeta(n1,0.3,1.5)
mu_j = rbeta(n2,0.3,1.5)
lambda_i = lambda_i/max(lambda_i)
mu_j = mu_j/max(mu_j)
N0=rgamma(n=n1*n2,shape=G/4,scale=lambda_i%*%t(mu_j)*4)
N=matrix(rpois(n1*n2,N0),nrow=n1)
R = M*N

obsrow = rowSums(R)>0
obscol = colSums(R)>0
R_obs = R[obsrow,obscol]
M_obs = M[obsrow,obscol]
Z1_obs = Z1[obsrow]
Z2_obs = Z2[obscol]
V = 1*(R_obs>0)

cov_row = lapply(2:nrow(V),function(k){
  X = matrix(0,nrow(V),ncol(V))
  X[k,] = 1
  X
})
cov_col = lapply(2:ncol(V),function(k){
  X = matrix(0,nrow(V),ncol(V))
  X[,k] = 1
  X
})


try1=fit_unsupervised_LBM(V,exploOptions = list(plot=FALSE,verbosity=F))
try2=fit_unsupervised_CoOP_LBM(R_obs,exploOptions = list(plot=F,verbosity=F))
try3 = estimateBipartiteSBM(R_obs,model = "poisson",covariates = c(cov_row,cov_col),estimOptions = list(plot=F,verbosity=0,exploreMax = 10))

model1 = try1[[best_ICL(try1)]]
model2 = try2[[best_ICL(try2)]]
model3 = try3

proba_connect1 = model1$pi[model1$cluster1,model1$cluster2]
proba_connect2 = model2$connectivity_prob
proba_connect3 = 1-exp(-fitted(model3))


ARIL1=ARI(model1$cluster1,Z1_obs)
ARIC1=ARI(model1$cluster2,Z2_obs)

ARIL2=ARI(model2$cluster1,Z1_obs)
ARIC2=ARI(model2$cluster2,Z2_obs)

ARIL3=ARI(model3$memberships$row,Z1_obs)
ARIC3=ARI(model3$memberships$col,Z2_obs)

AUC_LBM  = auc(roc(M_obs[V==0],proba_connect1[V==0],
                   direction="<",levels=levels(as.factor(c(0,1)))))
AUC_CoOP = auc(roc(M_obs[V==0],proba_connect2[V==0],
                   direction="<",levels=levels(as.factor(c(0,1)))))
AUC_DCSBM = auc(roc(M_obs[V==0],proba_connect3[V==0],
                    direction="<",levels=levels(as.factor(c(0,1)))))
result1[nrow(result1)+1,] = c(ARIL1,ARIC1,ARIL2,ARIC2,ARIL3,ARIC3,AUC_LBM,AUC_CoOP,AUC_DCSBM)

}
df1 = result1[c("ARI_row_LBM","ARI_row_CoOP","ARI_row_DCSBM")]
df1 = melt(df1)
#> No id variables; using all as measure variables
p1 <- ggplot(df1, aes(y=value,fill=variable))+
  geom_boxplot() +  theme(legend.position = "bottom",axis.text.x = element_text(angle = 90, vjust = 0.5, hjust=1)) + ggtitle("ARI for row clustering")+ labs(y="ARI",x="")+scale_fill_discrete(labels = c("LBM","CoOP-LBM","DCSBM"))+ guides(fill=guide_legend(title=""))+theme(axis.title.x=element_blank(),
        axis.text.x=element_blank(),
        axis.ticks.x=element_blank())+ylim(c(0,1))

df2 = result1[c("ARI_col_LBM","ARI_col_CoOP","ARI_col_DCSBM")]
df2 = melt(df2)
#> No id variables; using all as measure variables
p2 <- ggplot(df2, aes(y=value,fill=variable))+
  geom_boxplot()  +  theme(legend.position = "bottom",axis.text.x = element_text(angle = 90, vjust = 0.5, hjust=1)) + ggtitle("ARI for column clustering")+ labs(y="",x="")+scale_fill_discrete(labels = c("LBM","CoOP-LBM","DCSBM")) + guides(fill=guide_legend(title=""))+theme(axis.title.x=element_blank(),
        axis.text.x=element_blank(),
        axis.ticks.x=element_blank())+ylim(c(0,1))


grid.arrange(p1,p2,ncol=2)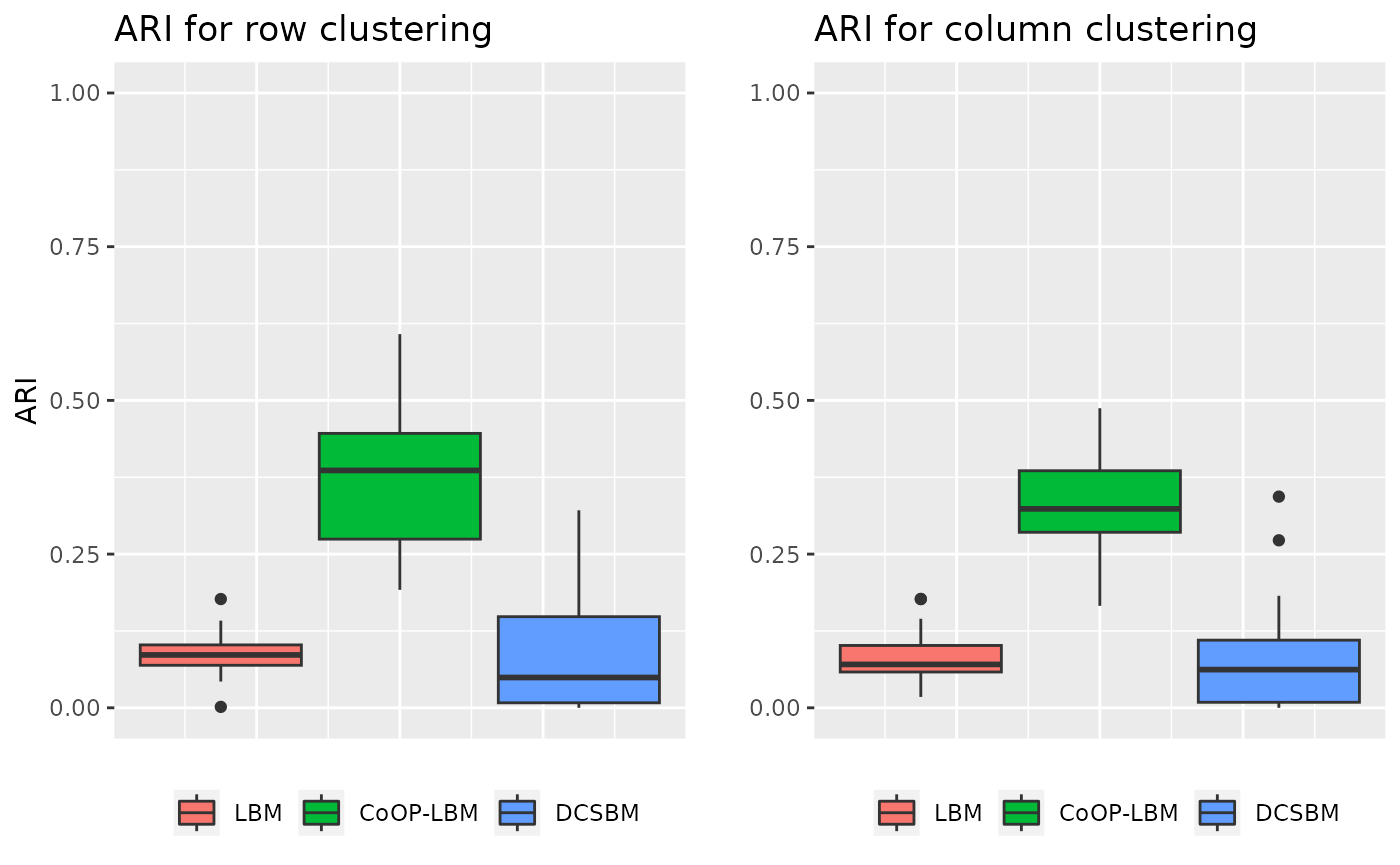
df3 = result1[c("AUC_LBM","AUC_CoOP","AUC_DCSBM")]

df3_long <- melt(df3)
#> No id variables; using all as measure variables
p3 <- ggplot(df3_long, aes(y=value,fill=variable))+
  geom_boxplot()  +  theme(axis.text.x = element_text(angle = 90, vjust = 0.5, hjust=1)) + ggtitle("AUC for missing data")+scale_fill_discrete(labels = c("LBM","CoOP-LBM","DCSBM")) + guides(fill=guide_legend(title=""))+labs(y="AUC")+theme(axis.title.x=element_blank(),
        axis.text.x=element_blank(),
        axis.ticks.x=element_blank())+ylim(c(0,1))
p3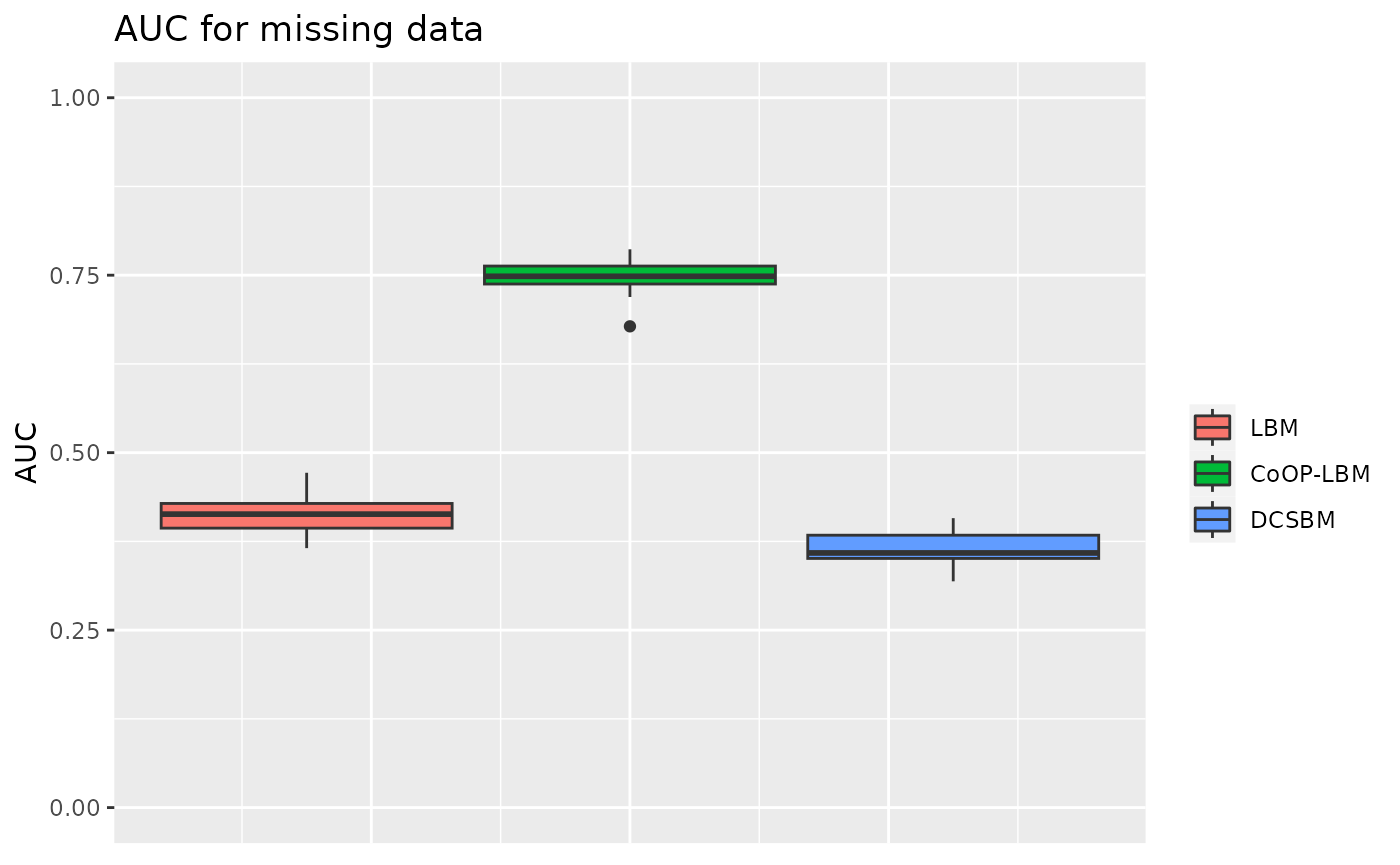
\(\lambda\) and \(\mu\) are structured in cluster independent from \(Z^1\) and \(Z^2\)
In this situation, \(\lambda\) and \(\mu\) are also structured, this simulation is done to see if the structure of the sampling can perturb the estimation of network’s structure.
result2 = data.frame(ARI_row_LBM=numeric(),
                    ARI_col_LBM=numeric(),
                    ARI_row_CoOP = numeric(),
                    ARI_col_CoOP = numeric(),
                    ARI_row_DCSBM = numeric(),
                    ARI_col_DCSBM = numeric(),
                    AUC_LBM = numeric(),
                    AUC_CoOP = numeric(),
                    AUC_DCSBM = numeric()
                   )
for (k in 1:30){
simulation1=simulate_lbm(P,alpha1,alpha2,n1,n2)
M = simulation1$A
Z1 =simulation1$Z
Z2 =simulation1$W
lambda_i =sample(c(0.01,0.25,0.5),size=100,replace=T,prob=c(0.5,0.4,0.1))
mu_j = sample(c(0.01,0.25,0.5),size=100,replace=T,prob=c(0.5,0.4,0.1))
lambda_i = lambda_i/max(lambda_i)
mu_j = mu_j/max(mu_j)
N0=lambda_i%*%t(mu_j)*G
N=matrix(rpois(n1*n2,N0),nrow=n1)
R = M*N

obsrow = rowSums(R)>0
obscol = colSums(R)>0
R_obs = R[obsrow,obscol]
M_obs = M[obsrow,obscol]
Z1_obs = Z1[obsrow]
Z2_obs = Z2[obscol]
V = 1*(R_obs>0)

cov_row = lapply(2:nrow(V),function(k){
  X = matrix(0,nrow(V),ncol(V))
  X[k,] = 1
  X
})
cov_col = lapply(2:ncol(V),function(k){
  X = matrix(0,nrow(V),ncol(V))
  X[,k] = 1
  X
})


try1=fit_unsupervised_LBM(V,exploOptions = list(plot=FALSE,verbosity=F))
try2=fit_unsupervised_CoOP_LBM(R_obs,exploOptions = list(plot=F,verbosity=F))
try3 = estimateBipartiteSBM(R_obs,model = "poisson",covariates = c(cov_row,cov_col),estimOptions = list(plot=F,verbosity=0,exploreMax = 10))

model1 = try1[[best_ICL(try1)]]
model2 = try2[[best_ICL(try2)]]
model3 = try3

proba_connect1 = model1$pi[model1$cluster1,model1$cluster2]
proba_connect2 = model2$connectivity_prob
proba_connect3 = 1-exp(-fitted(model3))


ARIL1=ARI(model1$cluster1,Z1_obs)
ARIC1=ARI(model1$cluster2,Z2_obs)

ARIL2=ARI(model2$cluster1,Z1_obs)
ARIC2=ARI(model2$cluster2,Z2_obs)

ARIL3=ARI(model3$memberships$row,Z1_obs)
ARIC3=ARI(model3$memberships$col,Z2_obs)

AUC_LBM  = auc(roc(M_obs[V==0],proba_connect1[V==0],
                   direction="<",levels=levels(as.factor(c(0,1)))))
AUC_CoOP = auc(roc(M_obs[V==0],proba_connect2[V==0],
                   direction="<",levels=levels(as.factor(c(0,1)))))
AUC_DCSBM = auc(roc(M_obs[V==0],proba_connect3[V==0],
                    direction="<",levels=levels(as.factor(c(0,1)))))
result2[nrow(result2)+1,] = c(ARIL1,ARIC1,ARIL2,ARIC2,ARIL3,ARIC3,AUC_LBM,AUC_CoOP,AUC_DCSBM)

}
df1 = result2[c("ARI_row_LBM","ARI_row_CoOP","ARI_row_DCSBM")]
df1 = melt(df1)
#> No id variables; using all as measure variables
p1 <- ggplot(df1, aes(y=value,fill=variable))+
  geom_boxplot() +  theme(legend.position = "bottom",axis.text.x = element_text(angle = 90, vjust = 0.5, hjust=1)) + ggtitle("ARI for row clustering")+ labs(y="ARI",x="")+scale_fill_discrete(labels = c("LBM","CoOP-LBM","DCSBM"))+ guides(fill=guide_legend(title=""))+theme(axis.title.x=element_blank(),
        axis.text.x=element_blank(),
        axis.ticks.x=element_blank())+ylim(c(0,1))

df2 = result2[c("ARI_col_LBM","ARI_col_CoOP","ARI_col_DCSBM")]
df2 = melt(df2)
#> No id variables; using all as measure variables
p2 <- ggplot(df2, aes(y=value,fill=variable))+
  geom_boxplot()  +  theme(legend.position = "bottom",axis.text.x = element_text(angle = 90, vjust = 0.5, hjust=1)) + ggtitle("ARI for column clustering")+ labs(y="",x="")+scale_fill_discrete(labels = c("LBM","CoOP-LBM","DCSBM")) + guides(fill=guide_legend(title=""))+theme(axis.title.x=element_blank(),
        axis.text.x=element_blank(),
        axis.ticks.x=element_blank())+ylim(c(0,1))


grid.arrange(p1,p2,ncol=2)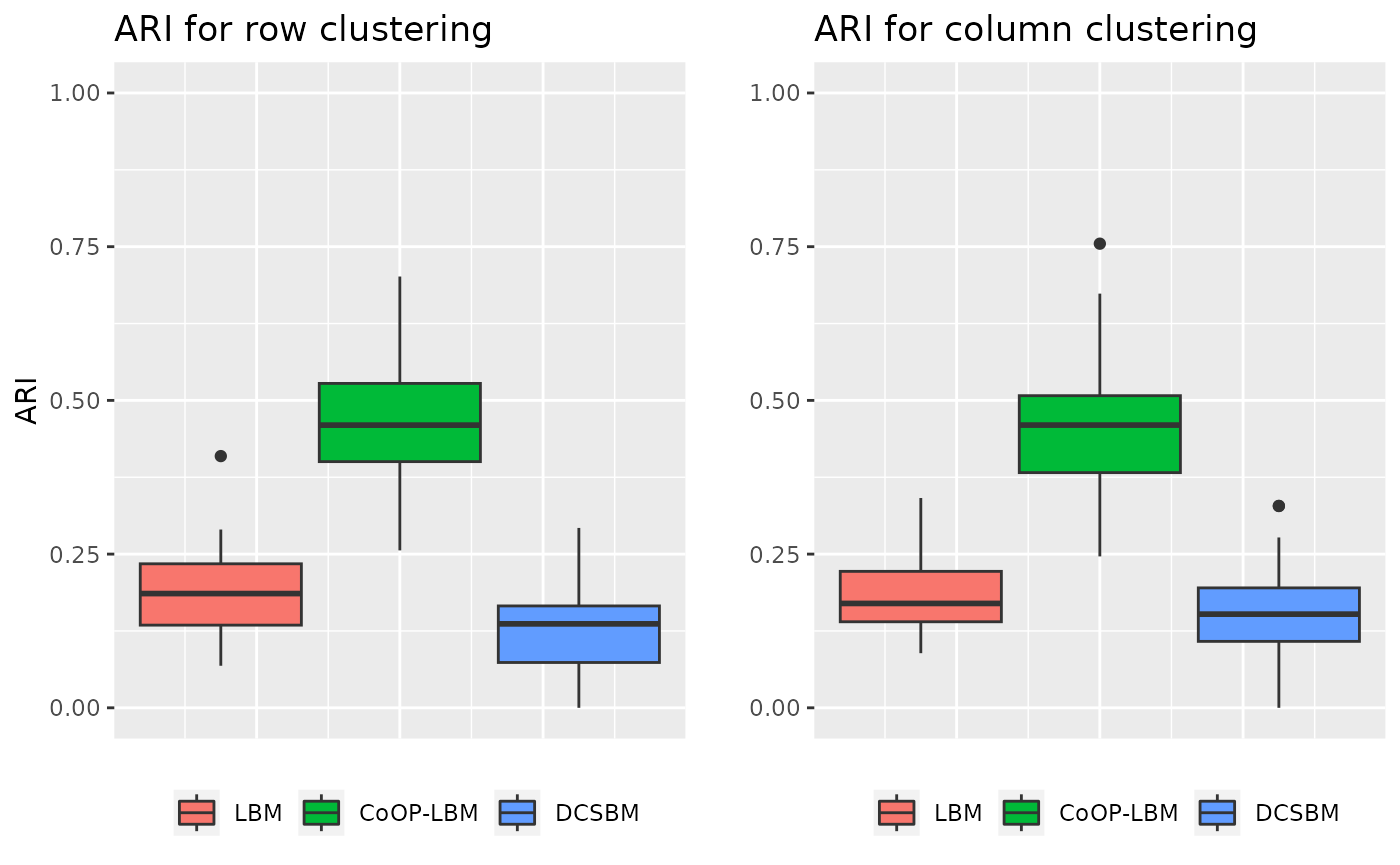
df3 = result2[c("AUC_LBM","AUC_CoOP","AUC_DCSBM")]

df3_long <- melt(df3)
#> No id variables; using all as measure variables
p3 <- ggplot(df3_long, aes(y=value,fill=variable))+
  geom_boxplot()  +  theme(axis.text.x = element_text(angle = 90, vjust = 0.5, hjust=1)) + ggtitle("AUC for missing data")+scale_fill_discrete(labels = c("LBM","CoOP-LBM","DCSBM")) + guides(fill=guide_legend(title=""))+labs(y="AUC")+theme(axis.title.x=element_blank(),
        axis.text.x=element_blank(),
        axis.ticks.x=element_blank())+ylim(c(0,1))
p3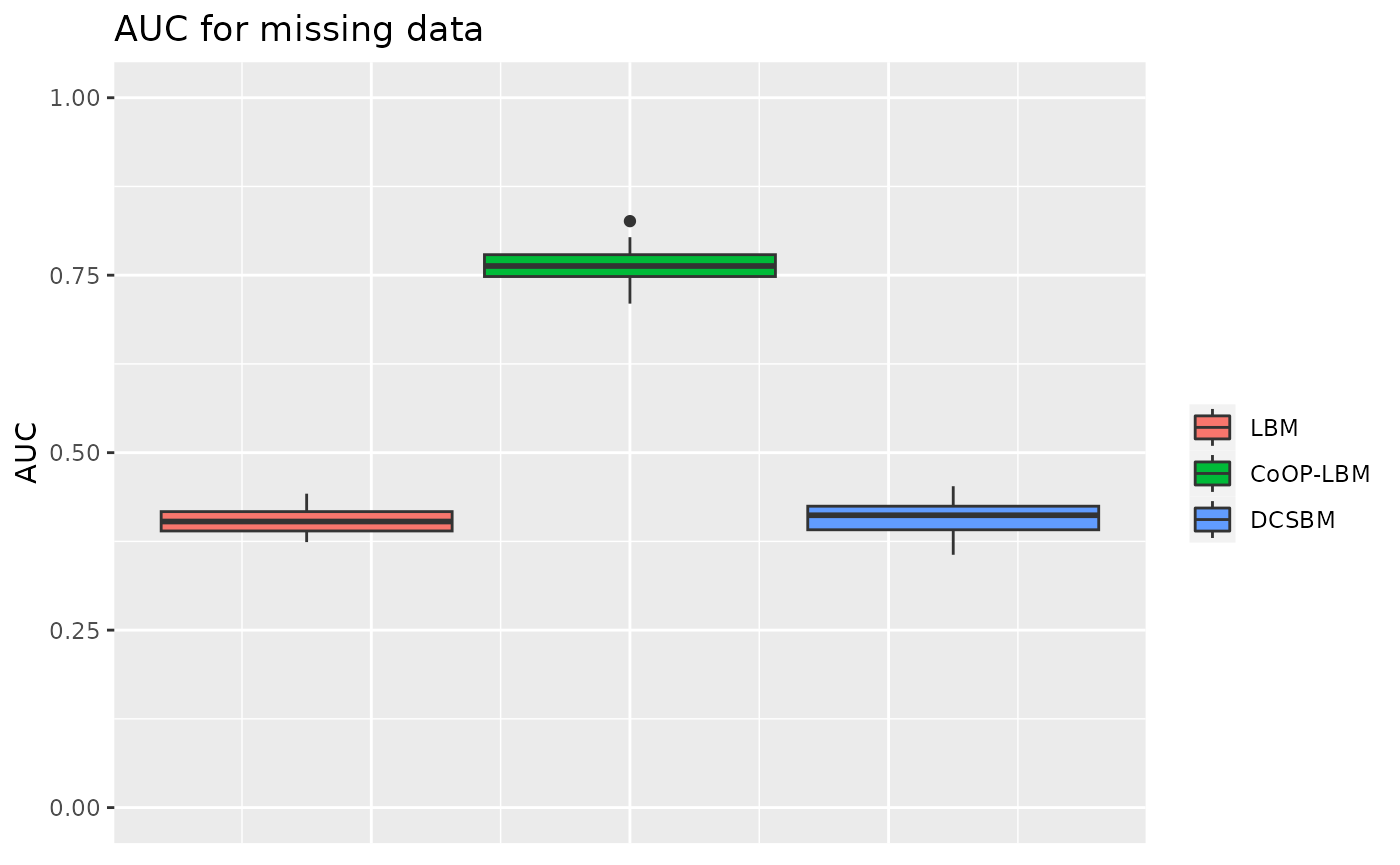
One line is over sampled compared to the other
In this situation, the model is the same as usual, but the parameter \(G\) is changed for one line, which represent an over sampled species.
result3 = data.frame(ARI_row_LBM=numeric(),
                    ARI_col_LBM=numeric(),
                    ARI_row_CoOP = numeric(),
                    ARI_col_CoOP = numeric(),
                    ARI_row_DCSBM = numeric(),
                    ARI_col_DCSBM = numeric(),
                    AUC_LBM = numeric(),
                    AUC_CoOP = numeric(),
                    AUC_DCSBM = numeric()
                   )
for (k in 1:30){
simulation1=simulate_lbm(P,alpha1,alpha2,n1,n2)
M = simulation1$A
Z1 =simulation1$Z
Z2 =simulation1$W
lambda_i =rbeta(n1,0.3,1.5)
mu_j = rbeta(n2,0.3,1.5)
lambda_i = lambda_i/max(lambda_i)
mu_j = mu_j/max(mu_j)
N0=lambda_i%*%t(mu_j)*G
N0[1,] = lambda_i[1] * mu_j * G * 6
N=matrix(rpois(n1*n2,N0),nrow=n1)
R = M*N

obsrow = rowSums(R)>0
obscol = colSums(R)>0
R_obs = R[obsrow,obscol]
M_obs = M[obsrow,obscol]
Z1_obs = Z1[obsrow]
Z2_obs = Z2[obscol]
V = 1*(R_obs>0)

cov_row = lapply(2:nrow(V),function(k){
  X = matrix(0,nrow(V),ncol(V))
  X[k,] = 1
  X
})
cov_col = lapply(2:ncol(V),function(k){
  X = matrix(0,nrow(V),ncol(V))
  X[,k] = 1
  X
})


try1=fit_unsupervised_LBM(V,exploOptions = list(plot=FALSE,verbosity=F))
try2=fit_unsupervised_CoOP_LBM(R_obs,exploOptions = list(plot=F,verbosity=F))
try3 = estimateBipartiteSBM(R_obs,model = "poisson",covariates = c(cov_row,cov_col),estimOptions = list(plot=F,verbosity=0,exploreMax = 10))

model1 = try1[[best_ICL(try1)]]
model2 = try2[[best_ICL(try2)]]
model3 = try3

proba_connect1 = model1$pi[model1$cluster1,model1$cluster2]
proba_connect2 = model2$connectivity_prob
proba_connect3 = 1-exp(-fitted(model3))


ARIL1=ARI(model1$cluster1,Z1_obs)
ARIC1=ARI(model1$cluster2,Z2_obs)

ARIL2=ARI(model2$cluster1,Z1_obs)
ARIC2=ARI(model2$cluster2,Z2_obs)

ARIL3=ARI(model3$memberships$row,Z1_obs)
ARIC3=ARI(model3$memberships$col,Z2_obs)

AUC_LBM  = auc(roc(M_obs[V==0],proba_connect1[V==0],
                   direction="<",levels=levels(as.factor(c(0,1)))))
AUC_CoOP = auc(roc(M_obs[V==0],proba_connect2[V==0],
                   direction="<",levels=levels(as.factor(c(0,1)))))
AUC_DCSBM = auc(roc(M_obs[V==0],proba_connect3[V==0],
                    direction="<",levels=levels(as.factor(c(0,1)))))
result3[nrow(result3)+1,] = c(ARIL1,ARIC1,ARIL2,ARIC2,ARIL3,ARIC3,AUC_LBM,AUC_CoOP,AUC_DCSBM)

}
df1 = result3[c("ARI_row_LBM","ARI_row_CoOP","ARI_row_DCSBM")]
df1 = melt(df1)
#> No id variables; using all as measure variables
p1 <- ggplot(df1, aes(y=value,fill=variable))+
  geom_boxplot() +  theme(legend.position = "bottom",axis.text.x = element_text(angle = 90, vjust = 0.5, hjust=1)) + ggtitle("ARI for row clustering")+ labs(y="ARI",x="")+scale_fill_discrete(labels = c("LBM","CoOP-LBM","DCSBM"))+ guides(fill=guide_legend(title=""))+theme(axis.title.x=element_blank(),
        axis.text.x=element_blank(),
        axis.ticks.x=element_blank())+ylim(c(0,1))

df2 = result3[c("ARI_col_LBM","ARI_col_CoOP","ARI_col_DCSBM")]
df2 = melt(df2)
#> No id variables; using all as measure variables
p2 <- ggplot(df2, aes(y=value,fill=variable))+
  geom_boxplot()  +  theme(legend.position = "bottom",axis.text.x = element_text(angle = 90, vjust = 0.5, hjust=1)) + ggtitle("ARI for column clustering")+ labs(y="",x="")+scale_fill_discrete(labels = c("LBM","CoOP-LBM","DCSBM")) + guides(fill=guide_legend(title=""))+theme(axis.title.x=element_blank(),
        axis.text.x=element_blank(),
        axis.ticks.x=element_blank())+ylim(c(0,1))


grid.arrange(p1,p2,ncol=2)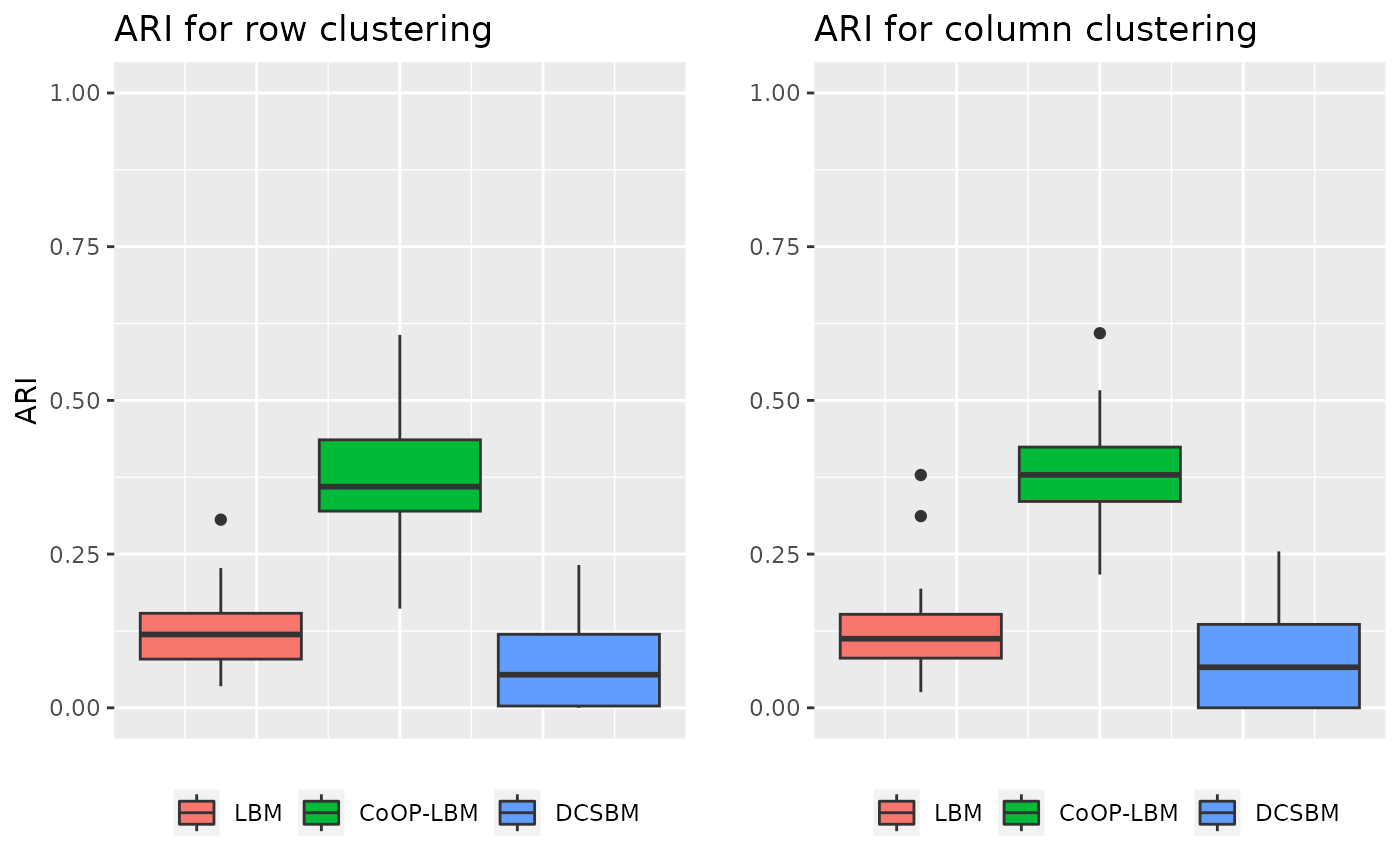
df3 = result3[c("AUC_LBM","AUC_CoOP","AUC_DCSBM")]

df3_long <- melt(df3)
#> No id variables; using all as measure variables
p3 <- ggplot(df3_long, aes(y=value,fill=variable))+
  geom_boxplot()  +  theme(axis.text.x = element_text(angle = 90, vjust = 0.5, hjust=1)) + ggtitle("AUC for missing data")+scale_fill_discrete(labels = c("LBM","CoOP-LBM","DCSBM")) + guides(fill=guide_legend(title=""))+labs(y="AUC")+theme(axis.title.x=element_blank(),
        axis.text.x=element_blank(),
        axis.ticks.x=element_blank())+ylim(c(0,1))
p3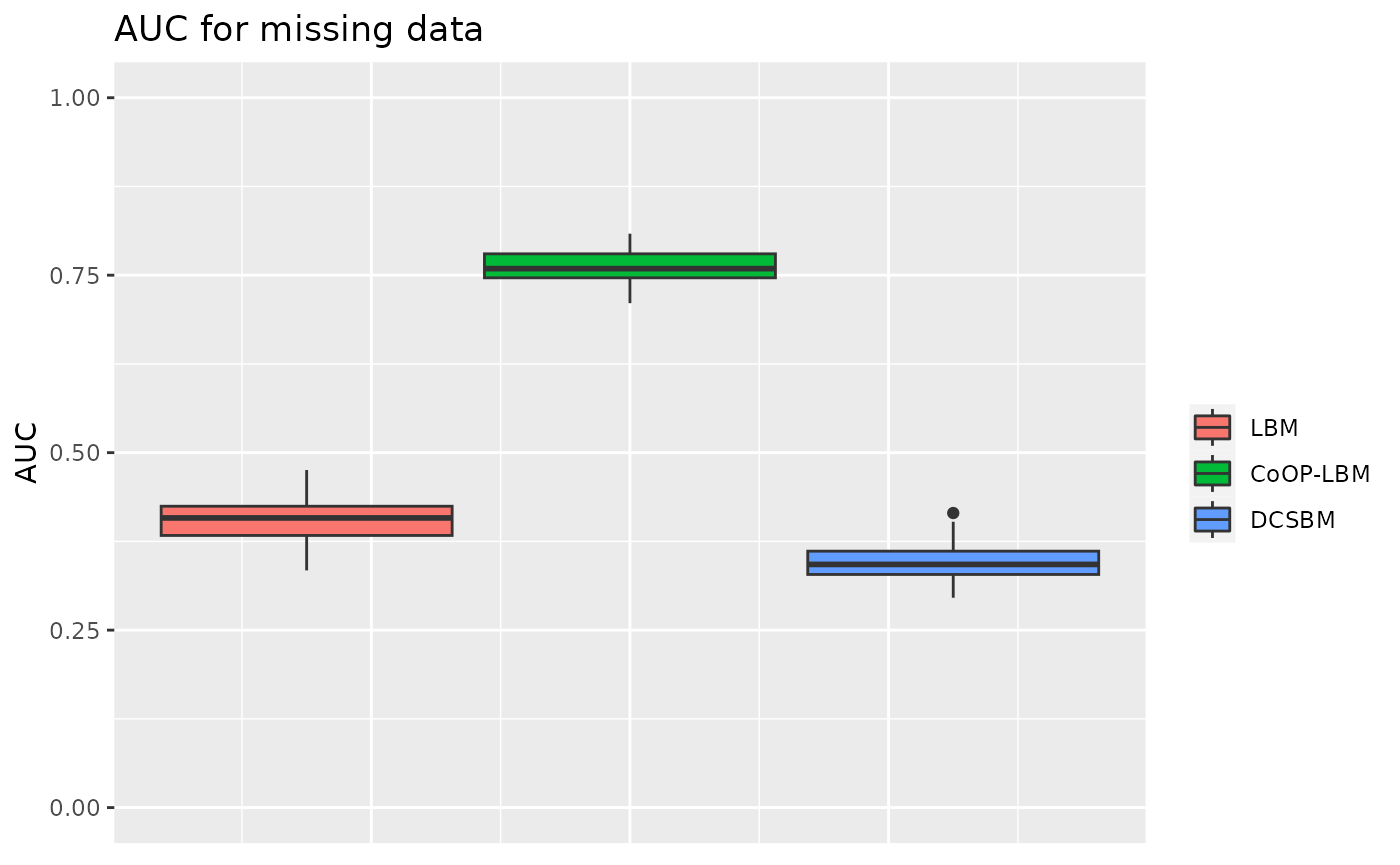
Global sampling effort is structured in cluster independent from \(Z^1\) and \(Z^2\)
In this situation, the model is the same as usual, but the parameter \(G\) depends on an clustering independent from \(Z^1\) and \(Z^2\)
result4 = data.frame(ARI_row_LBM=numeric(),
                    ARI_col_LBM=numeric(),
                    ARI_row_CoOP = numeric(),
                    ARI_col_CoOP = numeric(),
                    ARI_row_DCSBM = numeric(),
                    ARI_col_DCSBM = numeric(),
                    AUC_LBM = numeric(),
                    AUC_CoOP = numeric(),
                    AUC_DCSBM = numeric()
                   )
for (k in 1:30){

simulation1=simulate_lbm(P,alpha1,alpha2,n1,n2)
M = simulation1$A
Z1 =simulation1$Z
Z2 =simulation1$W

G0 = matrix(runif(16),nrow=4)*50+10
Z1G = sample(1:4,size=n1,replace=T)
Z2G = sample(1:4,size=n2,replace=T)
G0 = G0[Z1G,Z2G]
lambda_i =rbeta(n1,0.3,1.5)
mu_j = rbeta(n2,0.3,1.5)
lambda_i = lambda_i/max(lambda_i)
mu_j = mu_j/max(mu_j)
N0=lambda_i%*%t(mu_j)*G0
N=matrix(rpois(n1*n2,N0),nrow=n1)
R = M*N

obsrow = rowSums(R)>0
obscol = colSums(R)>0
R_obs = R[obsrow,obscol]
M_obs = M[obsrow,obscol]
Z1_obs = Z1[obsrow]
Z2_obs = Z2[obscol]
V = 1*(R_obs>0)

cov_row = lapply(2:nrow(V),function(k){
  X = matrix(0,nrow(V),ncol(V))
  X[k,] = 1
  X
})
cov_col = lapply(2:ncol(V),function(k){
  X = matrix(0,nrow(V),ncol(V))
  X[,k] = 1
  X
})


try1=fit_unsupervised_LBM(V,exploOptions = list(plot=FALSE,verbosity=F))
try2=fit_unsupervised_CoOP_LBM(R_obs,exploOptions = list(plot=F,verbosity=F))
try3 = estimateBipartiteSBM(R_obs,model = "poisson",covariates = c(cov_row,cov_col),estimOptions = list(plot=F,verbosity=0,exploreMax = 10))

model1 = try1[[best_ICL(try1)]]
model2 = try2[[best_ICL(try2)]]
model3 = try3

proba_connect1 = model1$pi[model1$cluster1,model1$cluster2]
proba_connect2 = model2$connectivity_prob
proba_connect3 = 1-exp(-fitted(model3))


ARIL1=ARI(model1$cluster1,Z1_obs)
ARIC1=ARI(model1$cluster2,Z2_obs)

ARIL2=ARI(model2$cluster1,Z1_obs)
ARIC2=ARI(model2$cluster2,Z2_obs)

ARIL3=ARI(model3$memberships$row,Z1_obs)
ARIC3=ARI(model3$memberships$col,Z2_obs)

AUC_LBM  = auc(roc(M_obs[V==0],proba_connect1[V==0],
                   direction="<",levels=levels(as.factor(c(0,1)))))
AUC_CoOP = auc(roc(M_obs[V==0],proba_connect2[V==0],
                   direction="<",levels=levels(as.factor(c(0,1)))))
AUC_DCSBM = auc(roc(M_obs[V==0],proba_connect3[V==0],
                    direction="<",levels=levels(as.factor(c(0,1)))))
result4[nrow(result4)+1,] = c(ARIL1,ARIC1,ARIL2,ARIC2,ARIL3,ARIC3,AUC_LBM,AUC_CoOP,AUC_DCSBM)

}
df1 = result4[c("ARI_row_LBM","ARI_row_CoOP","ARI_row_DCSBM")]
df1 = melt(df1)
#> No id variables; using all as measure variables
p1 <- ggplot(df1, aes(y=value,fill=variable))+
  geom_boxplot() +  theme(legend.position = "bottom",axis.text.x = element_text(angle = 90, vjust = 0.5, hjust=1)) + ggtitle("ARI for row clustering")+ labs(y="ARI",x="")+scale_fill_discrete(labels = c("LBM","CoOP-LBM","DCSBM"))+ guides(fill=guide_legend(title=""))+theme(axis.title.x=element_blank(),
        axis.text.x=element_blank(),
        axis.ticks.x=element_blank())+ylim(c(0,1))

df2 = result4[c("ARI_col_LBM","ARI_col_CoOP","ARI_col_DCSBM")]
df2 = melt(df2)
#> No id variables; using all as measure variables
p2 <- ggplot(df2, aes(y=value,fill=variable))+
  geom_boxplot()  +  theme(legend.position = "bottom",axis.text.x = element_text(angle = 90, vjust = 0.5, hjust=1)) + ggtitle("ARI for column clustering")+ labs(y="",x="")+scale_fill_discrete(labels = c("LBM","CoOP-LBM","DCSBM")) + guides(fill=guide_legend(title=""))+theme(axis.title.x=element_blank(),
        axis.text.x=element_blank(),
        axis.ticks.x=element_blank())+ylim(c(0,1))


grid.arrange(p1,p2,ncol=2)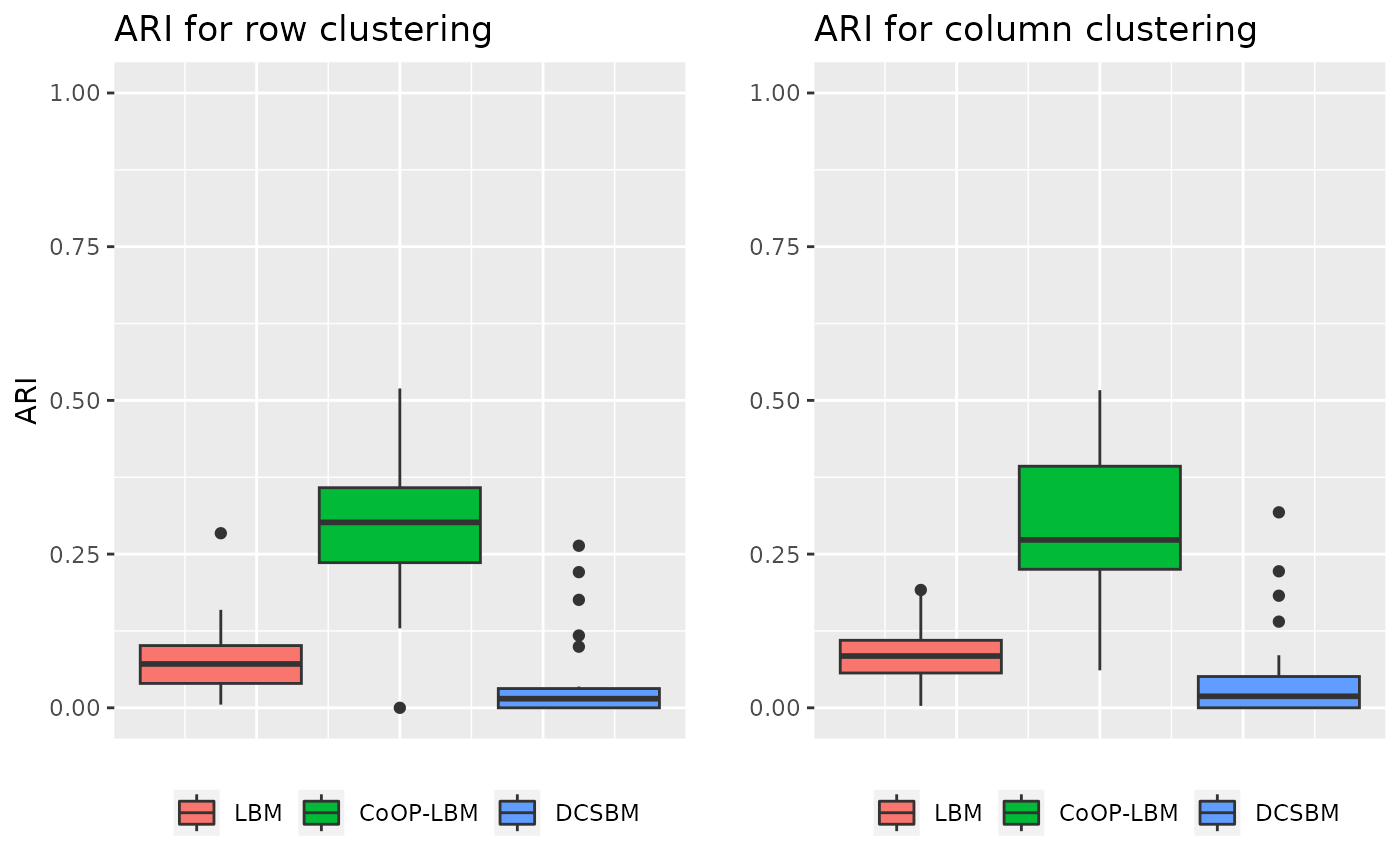
df3 = result4[c("AUC_LBM","AUC_CoOP","AUC_DCSBM")]

df3_long <- melt(df3)
#> No id variables; using all as measure variables
p3 <- ggplot(df3_long, aes(y=value,fill=variable))+
  geom_boxplot()  +  theme(axis.text.x = element_text(angle = 90, vjust = 0.5, hjust=1)) + ggtitle("AUC for missing data")+scale_fill_discrete(labels = c("LBM","CoOP-LBM","DCSBM")) + guides(fill=guide_legend(title=""))+labs(y="AUC")+theme(axis.title.x=element_blank(),
        axis.text.x=element_blank(),
        axis.ticks.x=element_blank())+ylim(c(0,1))
p3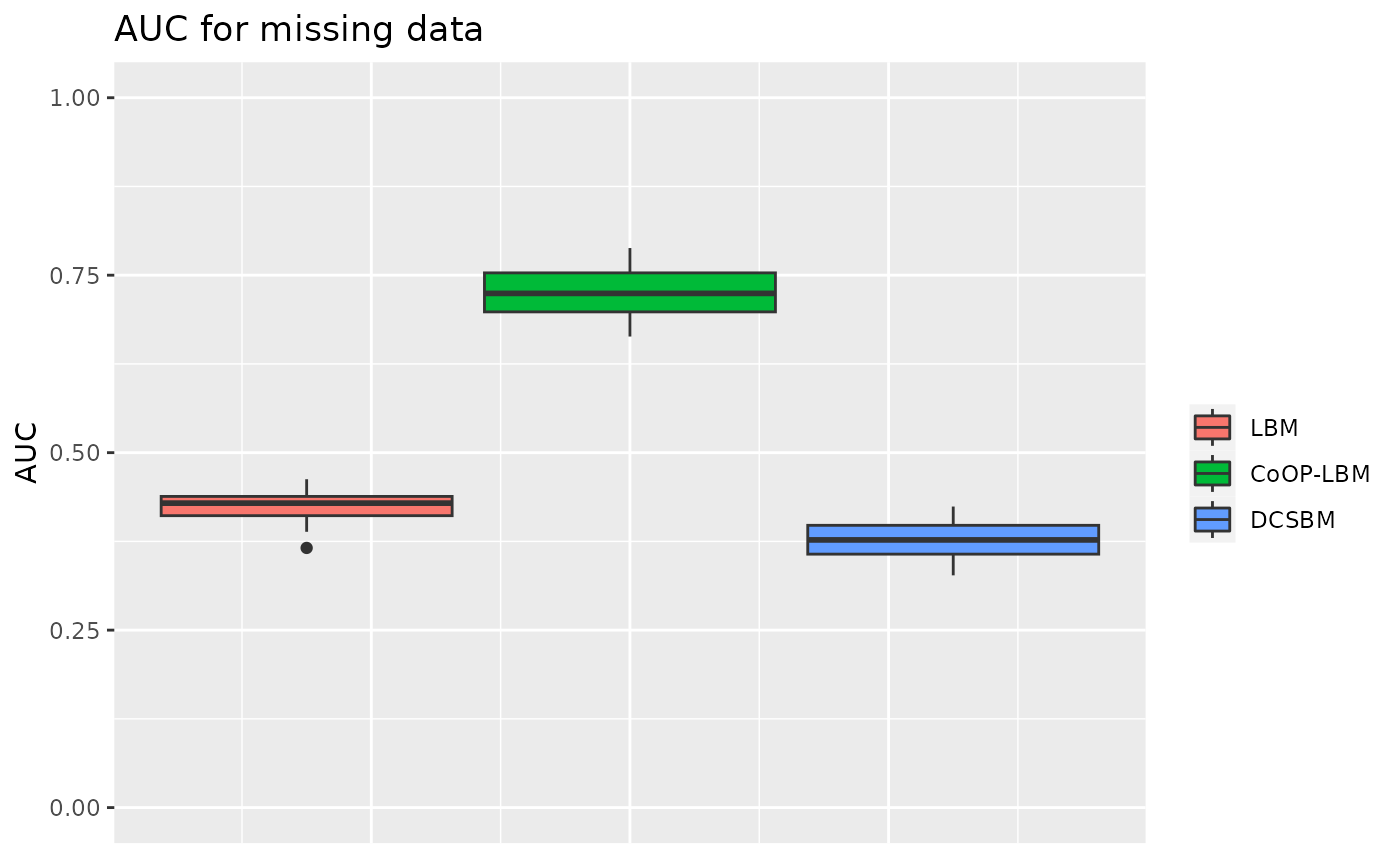
\(\lambda\) and \(\mu\) are structured in cluster identical to \(Z^1\) and \(Z^2\)
In this situation, \(\lambda\) and \(\mu\) are also structured, this simulation is done to see if the structure of the sampling can perturb the estimation of network’s structure.
result5 = data.frame(ARI_row_LBM=numeric(),
                    ARI_col_LBM=numeric(),
                    ARI_row_CoOP = numeric(),
                    ARI_col_CoOP = numeric(),
                    ARI_row_DCSBM = numeric(),
                    ARI_col_DCSBM = numeric(),
                    AUC_LBM = numeric(),
                    AUC_CoOP = numeric(),
                    AUC_DCSBM = numeric()
                   )
G=20
for (k in 1:30){
simulation1=simulate_lbm(P,alpha1,alpha2,n1,n2)
M = simulation1$A
Z1 =simulation1$Z
Z2 =simulation1$W
v1 = c(1,rbeta(2,0.3,1.5))
v2 = c(1,rbeta(2,0.3,1.5))
v1=sample(v1)
v2=sample(v2)
lambda_i =v1[Z1]
mu_j =v2[Z2]
N0=lambda_i%*%t(mu_j)*G
N=matrix(rpois(n1*n2,N0),nrow=n1)
R = M*N

obsrow = rowSums(R)>0
obscol = colSums(R)>0
R_obs = R[obsrow,obscol]
M_obs = M[obsrow,obscol]
Z1_obs = Z1[obsrow]
Z2_obs = Z2[obscol]
V = 1*(R_obs>0)

cov_row = lapply(2:nrow(V),function(k){
  X = matrix(0,nrow(V),ncol(V))
  X[k,] = 1
  X
})
cov_col = lapply(2:ncol(V),function(k){
  X = matrix(0,nrow(V),ncol(V))
  X[,k] = 1
  X
})


try1=fit_unsupervised_LBM(V,exploOptions = list(plot=FALSE,verbosity=F))
try2=fit_unsupervised_CoOP_LBM(R_obs,exploOptions = list(plot=F,verbosity=F))
try3 = estimateBipartiteSBM(R_obs,model = "poisson",covariates = c(cov_row,cov_col),estimOptions = list(plot=F,verbosity=0,exploreMax = 10))

model1 = try1[[best_ICL(try1)]]
model2 = try2[[best_ICL(try2)]]
model3 = try3

proba_connect1 = model1$pi[model1$cluster1,model1$cluster2]
proba_connect2 = model2$connectivity_prob
proba_connect3 = 1-exp(-fitted(model3))


ARIL1=ARI(model1$cluster1,Z1_obs)
ARIC1=ARI(model1$cluster2,Z2_obs)

ARIL2=ARI(model2$cluster1,Z1_obs)
ARIC2=ARI(model2$cluster2,Z2_obs)

ARIL3=ARI(model3$memberships$row,Z1_obs)
ARIC3=ARI(model3$memberships$col,Z2_obs)

AUC_LBM  = auc(roc(M_obs[V==0],proba_connect1[V==0],
                   direction="<",levels=levels(as.factor(c(0,1)))))
AUC_CoOP = auc(roc(M_obs[V==0],proba_connect2[V==0],
                   direction="<",levels=levels(as.factor(c(0,1)))))
AUC_DCSBM = auc(roc(M_obs[V==0],proba_connect3[V==0],
                    direction="<",levels=levels(as.factor(c(0,1)))))
result5[nrow(result5)+1,] = c(ARIL1,ARIC1,ARIL2,ARIC2,ARIL3,ARIC3,AUC_LBM,AUC_CoOP,AUC_DCSBM)

}
df1 = result5[c("ARI_row_LBM","ARI_row_CoOP","ARI_row_DCSBM")]
df1 = melt(df1)
#> No id variables; using all as measure variables
p1 <- ggplot(df1, aes(y=value,fill=variable))+
  geom_boxplot() +  theme(legend.position = "bottom",axis.text.x = element_text(angle = 90, vjust = 0.5, hjust=1)) + ggtitle("ARI for row clustering")+ labs(y="ARI",x="")+scale_fill_discrete(labels = c("LBM","CoOP-LBM","DCSBM"))+ guides(fill=guide_legend(title=""))+theme(axis.title.x=element_blank(),
        axis.text.x=element_blank(),
        axis.ticks.x=element_blank())+ylim(c(0,1))

df2 = result5[c("ARI_col_LBM","ARI_col_CoOP","ARI_col_DCSBM")]
df2 = melt(df2)
#> No id variables; using all as measure variables
p2 <- ggplot(df2, aes(y=value,fill=variable))+
  geom_boxplot()  +  theme(legend.position = "bottom",axis.text.x = element_text(angle = 90, vjust = 0.5, hjust=1)) + ggtitle("ARI for column clustering")+ labs(y="",x="")+scale_fill_discrete(labels = c("LBM","CoOP-LBM","DCSBM")) + guides(fill=guide_legend(title=""))+theme(axis.title.x=element_blank(),
        axis.text.x=element_blank(),
        axis.ticks.x=element_blank())+ylim(c(0,1))


grid.arrange(p1,p2,ncol=2)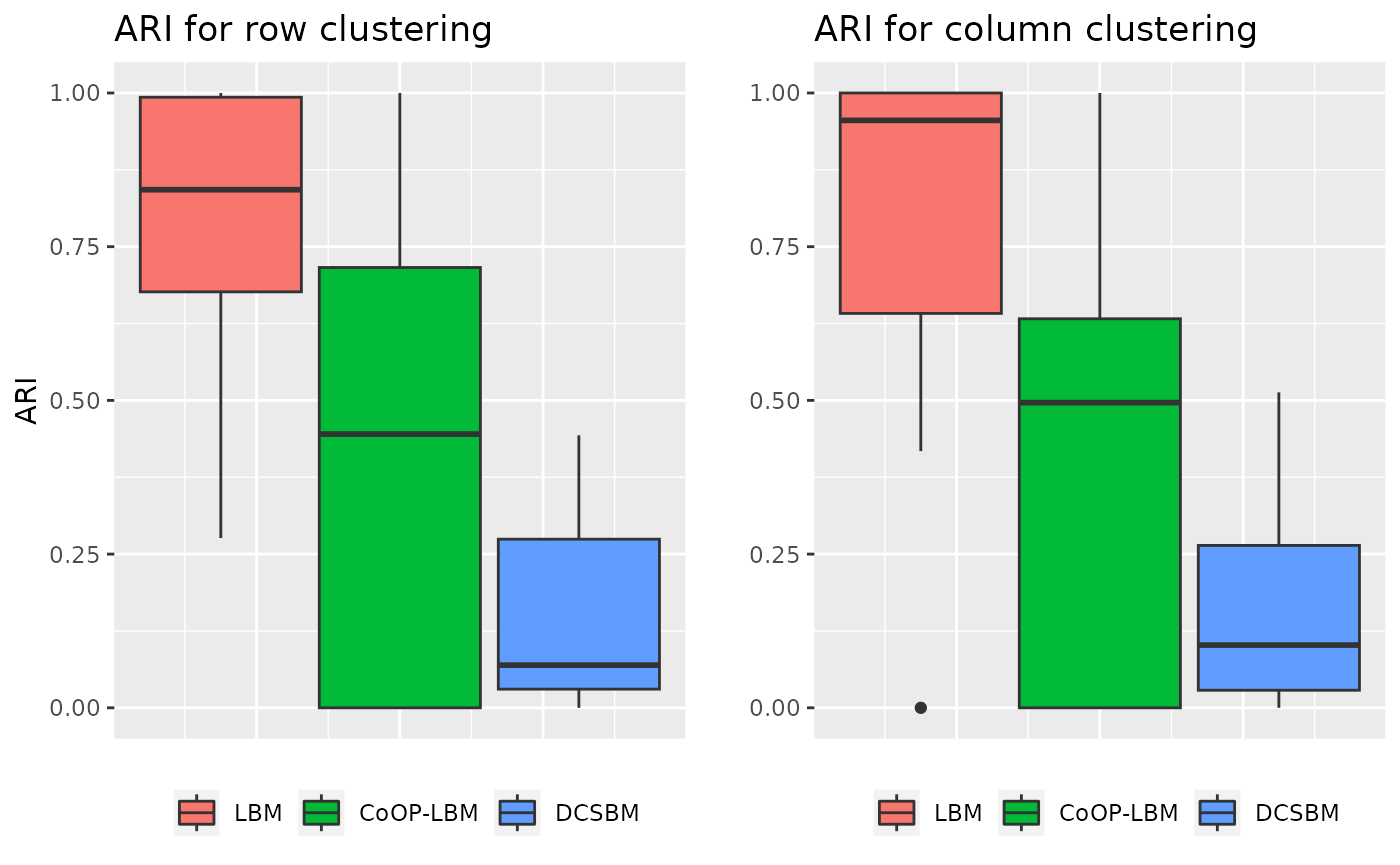
df3 = result5[c("AUC_LBM","AUC_CoOP","AUC_DCSBM")]

df3_long <- melt(df3)
#> No id variables; using all as measure variables
p3 <- ggplot(df3_long, aes(y=value,fill=variable))+
  geom_boxplot()  +  theme(axis.text.x = element_text(angle = 90, vjust = 0.5, hjust=1)) + ggtitle("AUC for missing data")+scale_fill_discrete(labels = c("LBM","CoOP-LBM","DCSBM")) + guides(fill=guide_legend(title=""))+labs(y="AUC")+theme(axis.title.x=element_blank(),
        axis.text.x=element_blank(),
        axis.ticks.x=element_blank())+ylim(c(0,1))
p3