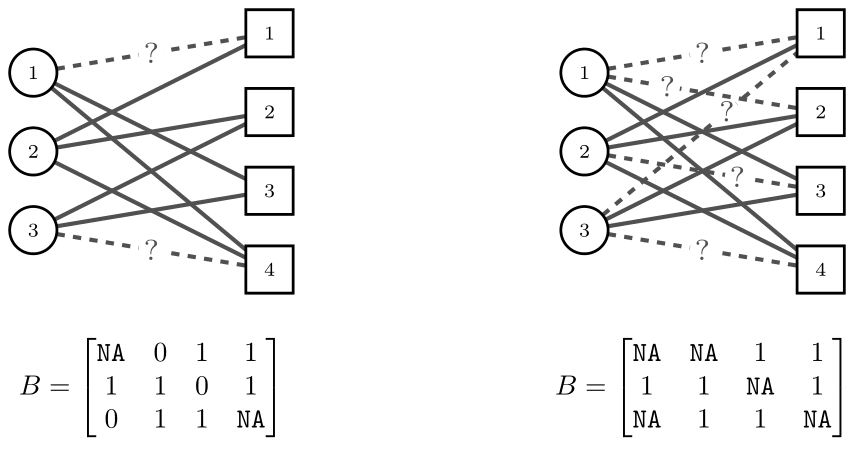
Missing data VS incomplete data
Difference between missing data (left) and incomplete data (right) in the context of networks.
\documentclass[border=3pt,tikz]{standalone}
\usepackage{amsmath}
\usepackage[dvipsnames]{xcolor}
\usepackage{pgfplots}
\definecolor{taupegray}{rgb}{0.55, 0.52, 0.54}
\usepackage{tikz-network}

\begin{document}

\begin{tikzpicture}


    %\draw (0.1,1.25) node{$V^1$};
    \Vertex[x=0,y=0,label=1,color=white]{n1}
    \Vertex[x=0,y=-1,label=2,color=white]{n2}
    \Vertex[x=0,y=-2,label=3,color=white]{n3}

    %\draw (3.1,1.25) node{$V^2$};
    \Vertex[x=3,y=0.5,label=1,color=white,shape = rectangle]{m1}
    \Vertex[x=3,y=-0.5,label=2,color=white,shape = rectangle]{m2}
    \Vertex[x=3,y=-1.5,label=3,color=white,shape = rectangle]{m3}
    \Vertex[x=3,y=-2.5,label=4,color=white,shape = rectangle]{m4}


    \Edge[style=dashed,label=?,fontscale=1.5](n1)(m1)
    \Edge(n1)(m3)
    \Edge(n1)(m4)

    \Edge(n2)(m1)
    \Edge(n2)(m2)
    \Edge(n2)(m4)

    \Edge(n3)(m2)
    \Edge(n3)(m3)
    \Edge[style=dashed,label=?,fontscale=1.5](n3)(m4)


    \draw (1.5,-4) node[scale=1]{
        $B = \begin{bmatrix}
        \texttt{NA} & 0 & 1 & 1 \\
        1 & 1 & 0 & 1 \\
        0 & 1 & 1 & \texttt{NA} \\
        \end{bmatrix}
        $};


        \begin{scope}[xshift=7 cm]

            %\draw (0.1,1.25) node{$V^1$};
            \Vertex[x=0,y=0,label=1,color=white]{n1a}
            \Vertex[x=0,y=-1,label=2,color=white]{n2a}
            \Vertex[x=0,y=-2,label=3,color=white]{n3a}

            %\draw (3.1,1.25) node{$V^2$};
            \Vertex[x=3,y=0.5,label=1,color=white,shape = rectangle]{m1a}
            \Vertex[x=3,y=-0.5,label=2,color=white,shape = rectangle]{m2a}
            \Vertex[x=3,y=-1.5,label=3,color=white,shape = rectangle]{m3a}
            \Vertex[x=3,y=-2.5,label=4,color=white,shape = rectangle]{m4a}


            \Edge[style=dashed,label=?,fontscale=1.5](n1a)(m1a)
            \Edge(n1a)(m3a)
            \Edge(n1a)(m4a)

            \Edge(n2a)(m1a)
            \Edge(n2a)(m2a)
            \Edge(n2a)(m4a)

            \Edge(n3a)(m2a)
            \Edge(n3a)(m3a)

            \Edge[style=dashed,label=?,fontscale=1.5,distance=.3](n1a)(m2a)
            \Edge[style=dashed,label=?,fontscale=1.5,distance=.7](n2a)(m3a)
            \Edge[style=dashed,label=?,fontscale=1.5,distance=.65](n3a)(m1a)
            \Edge[style=dashed,label=?,fontscale=1.5](n3a)(m4a)


    \draw (1.5,-4) node[scale=1]{
        $B = \begin{bmatrix}
            \texttt{NA} & \texttt{NA} & 1 & 1 \\
        1 & 1 & \texttt{NA} & 1 \\
        \texttt{NA} & 1 & 1 & \texttt{NA} \\
        \end{bmatrix}
        $};


        \end{scope}


\end{tikzpicture}
\end{document}