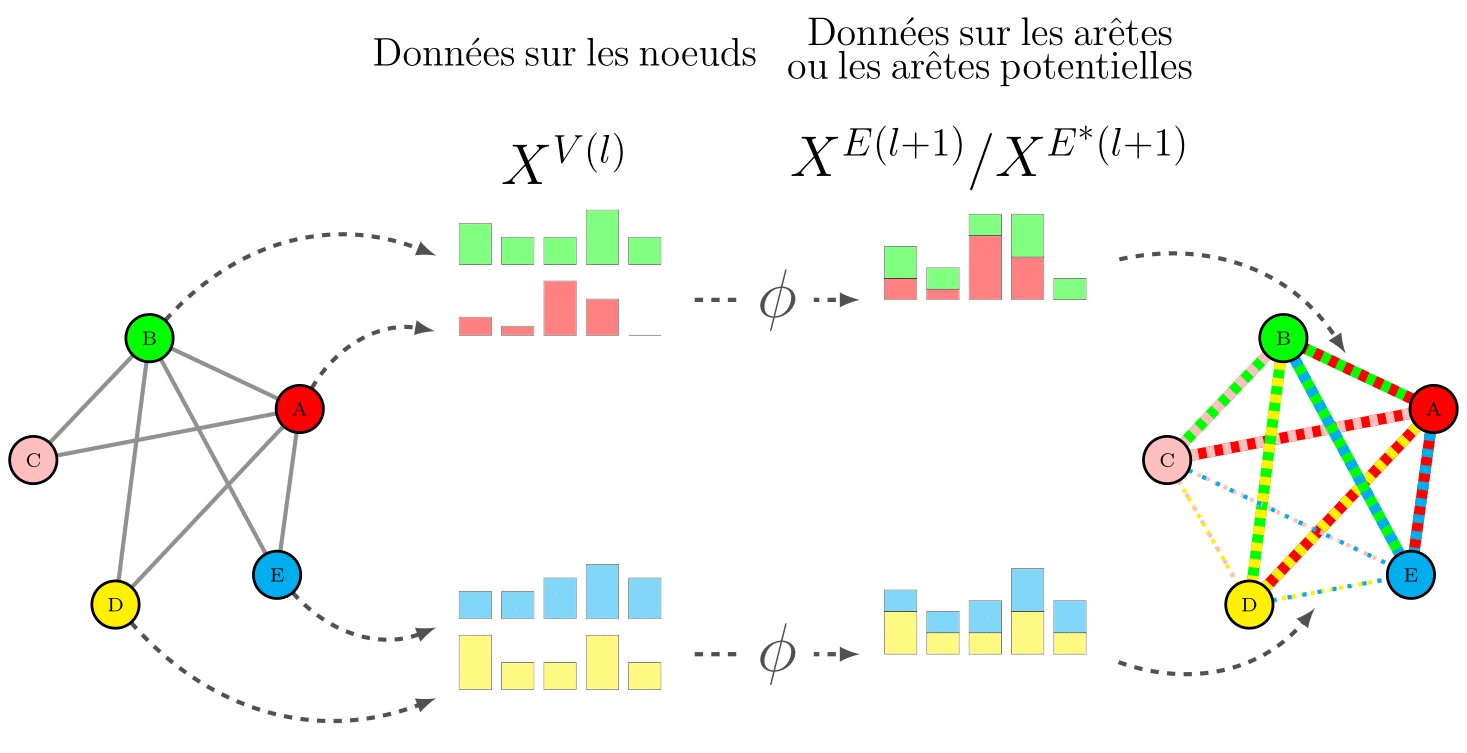
Pooling from nodes to edges
Pooling operation from nodes to edges
\documentclass[border=3pt,tikz]{standalone}
\usepackage{amsmath}
\usepackage[dvipsnames]{xcolor}
\usepackage{pgfplots}
\definecolor{taupegray}{rgb}{0.55, 0.52, 0.54}
\def\general_height{0.2}
\usepackage{tikz-network}
\begin{document}


\begin{tikzpicture}
\begin{scope}[scale=0.9]

\begin{scope}[scale=2,xshift=-1cm]
    \Vertex[x=0.88,y=0.48,label=A,color=red]{A}
    \Vertex[x=-0.18,y=0.98,label=B,color=green]{B}
    \Vertex[x=-1,y=0.12,label=C,color=pink]{C}
    \Vertex[x=-0.42,y=-0.9,label=D,color=yellow]{D}
    \Vertex[x=0.72,y=-0.69,label=E,color=cyan]{E}
    \Edge[color=gray](A)(B)
    \Edge[color=gray](A)(C)
    \Edge[color=gray](A)(D)
    \Edge[color=gray](A)(E)
    \Edge[color=gray](B)(C)
    \Edge[color=gray](B)(D)
    \Edge[color=gray](B)(E)
\end{scope}

\begin{scope}[xshift=2cm]
\node[] at (1.5cm,4.5cm) {\huge $X^{V(l)}$};
\node[align = center, text width=5cm] at (1.5cm,6cm) {\Large Données sur les noeuds };

\Vertex[x=0,y=3,Pseudo]{bar_1}
\begin{axis}[ybar stacked,
yshift = 3cm,
height=\general_height\textwidth,
 bar width=13pt,ymin=0,
 x=17pt,
 ytick=\empty,
 xtick=\empty,
 hide axis]
    \addplot[fill=green,opacity=0.5] coordinates
        {(0,0.15) (1,0.1) (2,0.1) (3,0.2) (4,0.1)};
    \end{axis}

\Vertex[x=0,y=2,Pseudo]{bar_2}
\begin{axis}[ybar stacked,
yshift = 2cm,
height=\general_height\textwidth,
 bar width=13pt,ymin=0,
 x=17pt,
 ytick=\empty,
 xtick=\empty,
 hide axis]
    \addplot[fill=red,opacity=0.5] coordinates
        {(0,0.1) (1,0.05) (2,0.3) (3,0.2) (4,0.0)};
    \end{axis}


\Vertex[x=0,y=-2,Pseudo]{bar_4}
\begin{axis}[ybar stacked,
yshift = -2cm,
height=\general_height\textwidth,
 bar width=13pt,ymin=0,
 x=17pt,
 ytick=\empty,
 xtick=\empty,
 hide axis]
    \addplot[fill=cyan,opacity=0.5] coordinates
        {(0,0.1) (1,0.1) (2,0.15) (3,0.2) (4,0.15)};
    \end{axis}


\Vertex[x=0,y=-3,Pseudo]{bar_7}

\begin{axis}[ybar stacked,
yshift = -3cm,
height=\general_height\textwidth,
 bar width=13pt,ymin=0,
 x=17pt,
 ytick=\empty,
 xtick=\empty,
 hide axis]
\addplot[fill=yellow,opacity=0.5] coordinates
        {(0,0.2) (1,0.1) (2,0.1) (3,0.2) (4,0.1)};
\end{axis}

 \Vertex[x=3,y=2.5,Pseudo]{barplots}
 \Vertex[x=3,y=-2.5,Pseudo]{barplots2}


\end{scope}

\begin{scope}[xshift=8cm]
\node[] at (1.5cm,4.5cm) {\huge $X^{E(l+1)}/X^{E^*(l+1)}$};
\node[align = center, text width=6cm] at (1.5cm,6cm) {\Large Données sur les arêtes ou les arêtes potentielles};

\Vertex[x=0,y=2.5,Pseudo]{agregation}
\Vertex[x=0,y=-2.5,Pseudo]{agregation2}


\begin{axis}[ybar stacked,
height= 1.2*\general_height\textwidth,
yshift = 2.5cm,
 bar width=13pt,ymin=0,
 x=17pt,
 ytick=\empty,
 xtick=\empty,
 hide axis]
  \addplot[fill=red,opacity=0.5] coordinates
  {(0,0.1) (1,0.05) (2,0.3) (3,0.2) (4,0.0)};
  \addplot[fill=green,opacity=0.5] coordinates
  {(0,0.15) (1,0.1) (2,0.1) (3,0.2) (4,0.1)};
 \end{axis}
 \Vertex[x=3,y=3,Pseudo]{N}

 \begin{axis}[ybar stacked,
    height= 1.2*\general_height\textwidth,
    yshift = -2.5cm,
     bar width=13pt,ymin=0,
     x=17pt,
     ytick=\empty,
     xtick=\empty,
     hide axis]
     \addplot[fill=yellow,opacity=0.5] coordinates
     {(0,0.2) (1,0.1) (2,0.1) (3,0.2) (4,0.1)};


     \addplot[fill=cyan,opacity=0.5] coordinates
     {(0,0.1) (1,0.1) (2,0.15) (3,0.2) (4,0.15)};


     \end{axis}
     \Vertex[x=3,y=-2.5,Pseudo]{N2}
\end{scope}


\Edge[bend=35,style={dashed},Direct](A)(bar_2)
%\Edge[bend=35,style={dashed},Direct]($(A)!.5!(C)$)(bar_3)
%\Edge[bend=-35,style={dashed},Direct]($(A)!.5!(D)$)(bar_6)
%\Edge[bend=-35,style={dashed},Direct]($(A)!.5!(E)$)(bar_5)
\Edge[bend=35,style={dashed},Direct](B)(bar_1)
\Edge[bend=-35,style={dashed},Direct](D)(bar_7)
\Edge[bend=-35,style={dashed},Direct](E)(bar_4)


\begin{scope}[xshift=14cm,scale=2]
\Vertex[x=0.88,y=0.48,label=A,color=red]{A2}
\Vertex[x=-0.18,y=0.98,label=B,color=green]{B2}
\Vertex[x=-1,y=0.12,label=C,color=pink]{C2}
\Vertex[x=-0.42,y=-0.9,label=D,color=yellow]{D2}
\Vertex[x=0.72,y=-0.69,label=E,color=cyan]{E2}

\Vertex[x=0.35,y=0.73,color=red,Pseudo]{A2B2}
\Vertex[x=0.15,y=-0.795,color=red,Pseudo]{D2E2}


\Edge[color=green,lw=4](A2)(B2)
\Edge[color=red,style={dashed},lw=4](A2)(B2)

\Edge[color=red,lw=4](A2)(C2)
\Edge[color=pink,style={dashed},lw=4](A2)(C2)

\Edge[color=red,lw=4](A2)(D2)
\Edge[color=yellow,style={dashed},lw=4](A2)(D2)

\Edge[color=red,lw=4](A2)(E2)
\Edge[color=cyan,style={dashed},lw=4](A2)(E2)

\Edge[color=green,lw=4](B2)(C2)
\Edge[color=pink,style={dashed},lw=4](B2)(C2)

\Edge[color=green,lw=4](B2)(D2)
\Edge[color=yellow,style={dashed},lw=4](B2)(D2)

\Edge[color=green,lw=4](B2)(E2)
\Edge[color=cyan,style={dashed},lw=4](B2)(E2)

\Edge[color=yellow,style = {dotted}](D2)(E2)
\Edge[color=cyan  ,style = {loosely dotted}](D2)(E2)

\Edge[color=yellow,style = {dotted}](C2)(D2)
\Edge[color=pink  ,style = {loosely dotted}](C2)(D2)

\Edge[color=pink,style = {dotted}](C2)(E2)
\Edge[color=cyan  ,style = {loosely dotted}](C2)(E2)

\end{scope}

\Edge[style={dashed},Direct,label={\Huge $\phi$}](barplots)(agregation)
\Edge[style={dashed},Direct,label={\Huge $\phi$}](barplots2)(agregation2)


\Edge[style={dashed},bend=35,Direct](N)(A2B2)
\Edge[style={dashed},bend=-35,Direct](N2)(D2E2)

\end{scope}
\end{tikzpicture}


\end{document}