The following code assumes that the following files are located in the same directory as the .tex file :vertices.csv edges.csv
vertices = read.table("vertices.csv",header=T, sep= ",")
head(vertices)
  id          x          y  color
1  H -1.6101224  0.2582157 yellow
2  2 -0.7862112  0.1226055 yellow
3  3 -0.2621141  0.9662158 yellow
4  4 -1.3783554  1.1100772 yellow
5  5 -2.8386329 -0.4002378 yellow
6  6 -3.4978099 -0.2904431 yellow
edges = read.table("edges.csv",header=T, sep= ",")
head(edges)
  u v
1 H 2
2 H 3
3 H 4
4 H 5
5 H 6
6 H 7
\documentclass[border=3pt,tikz]{standalone}
\usepackage{amsmath}
\usepackage[dvipsnames]{xcolor}
\usepackage{pgfplots}
\definecolor{taupegray}{rgb}{0.55, 0.52, 0.54}
\usepackage{tikz-network}
\begin{document}
\begin{tikzpicture}
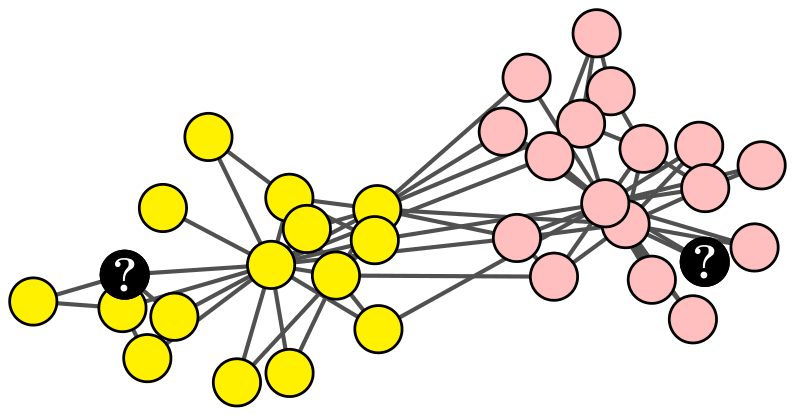
\Vertices[color=vertexfill]{vertices.csv}
\Edges{edges.csv}
\Edge[style={dashed},label=\textbf{?},fontcolor=black,fontsize=\LARGE](13)(10)
\Edge[style={dashed},label=\textbf{?},fontcolor=black,fontsize=\LARGE](20)(21)
\Edge[style={dashed},label=\textbf{?},fontcolor=black,fontsize=\LARGE](17)(13)
\end{tikzpicture}
\end{document}